Using Elastic stack (ELK) on embedded [part 1]
Intro
[Update - 04.09.2020]: Added info how to use Yocto to build the official elastic beats
Data collection and visualization are two very important things that when are used properly they are actually very useful. The last decade we’re overwhelmed with data and especially with how the data are visualized. Most of the cases, I believe, people don’t even understand what they see or how to interpret the data visualizations. It has become more important in the industry to present data in a visual pleasing way, rather actually to get a meaning out of them. But that’s another story for a more philosophical post.
In this series of posts I’ll won’t solve the above problem but I will probably contribute in to making it even worse and I’ll do that by explaining how to use Elasticsearch (and some other tools) with your embedded devices. An embedded device in this case can be either a Linux SBC or a micro-controller which is able to collect and send data (e.g. ESP8266). Since there are so many different use cases and scenarios, I’ll start with simple a simple concept in this post and then it will get more advanced in the next posts.
One thing that you need to have in mind is that data collection and presentation is something that goes many centuries back. Anyway in case of IT there’s only a few decades of history in presenting digital data. If you think about it, only the tools are getting different as the technology advances and as happens with all new things, those tools are getting more fancy, bloated and complicated, but at the same time more flexible. So nothing new here, just old concepts with new tools. Does that mean that they’re bad? No, not all. They are very useful when you use them right.
Elastic Stack
There are dozens of tools and frameworks to collect and visualize data. You can even implement you own simple framework to do that. For example in this post, I’ve designed an electronic load with a web interface. That’s pretty much data collection and visualization. OK, I know, you may say that it’s not really data collection because there is no a database, but that doesn’t really mean anything as you can have a circular buffer with the last 10 values and would make it data collector. Anyway, it doesn’t matter how complex you application and infrastructure is, the only thing that matters is that the ground concept is the same.
So, Elastic Stack (EStack) is a collection of open-source tools that collect, store and visualize data. There are many other frameworks, but I’ve chosen EStack because it’s open source, nowadays is a mature framework and it’s quite popular in the DevOps community. The main tools of the EStack are: Elasticsearch (ES), Kibana (KB), Logstash (LS) and Beats, but there are also others. Here is a video that explains a bit better how those tools are connected together.
It’s quite simple to understand what they do though. Elasticsearch is a database server that collects and stores data. Logstash and beats are clients that send data to the database and Kibana is just a user-interface that presents the data on a web page. That’s it. Simple. Of course that the main concept of the tools, but they offer much more than that and they are adding new functionalities really fast.
Now, the way they do what they do and the implementation is what it’s quite complicate. So EStack is quite a large framework. Protocols, security, databases, visualization, management, alerts and configuration is what it makes those frameworks huge. Therefore, the user or the administrator deals with less complexity, but in return the frameworks are getting larger and the internal complexity makes the user much less able to debug or resolve any problems inside the infrastructure. So, you win some, you lose some.
Most of the times, the moto is, if it works without problems for some time you’re lucky, but if it breaks you’re doomed. Of course at some point things break eventually, so this is where you need backups, because if your database gets corrupted then good luck with it if you have no backup.
Back to EStack… The Elasticsearch is a server with a database. You can have multiple ES server nodes running at the same time and different type of data can be stored on each server. But you’re able to have access to all the data from the different nodes with a single query. Then, you can have multiple Logstash and Beats clients that connect to one or more nodes. The clients are sending data to the server and the server stores the data to the database. The difference with older similar implementations is that ES uses the json syntax that receives from the client to store the data in the DB. I’m not sure about the implementation details and I may be wrong in my assumption, but I assume that ES creates tables on the fly with fields according to this json syntax if they don’t already aexist. So ES is aware of client’s data formatting when receiving well formated data. Anyway, the important thing is that the data are stored in the DB in a way that you can run queries and filters to obtain information from the database.
The main difference between Logstash and Beats clients is that Logstash is a generic client with multiple configurable functionality that can be configured to do anything, but Beats are lightweight clients which are tailored to collect and send specific type of data. For example you can configure Logstash to send 10 different types of data or you can even have many different Beats that send data to a Logstash client, which then re-formats and sends the data to an Elasticsearch server. On the other hand, Beats can deal only with specific type of data, for example they can collect and send the overview of the system resources of the host (client) or send the status of a specific server or poll a log file and then parse new lines and format the log data and send them back to the server. Each Beat is different. Here you can search all the available community Beats and here the official beats.
Beats are just simple client programs written in Go that they’re using the libeat Go API and perform very specific tasks. You can use this API to write your own beat clients in Go that can do whatever you like. The API just provides the interface and implements the network communication including authentication. At the higher level a Beat is split into two components, the component that collects the data and implements the business logic (e.g. reading a temperature/humidity sensor) and the publisher component that handles all the communication with the server including authorization, timeouts e.t.c. The diagram below is simple to understand.
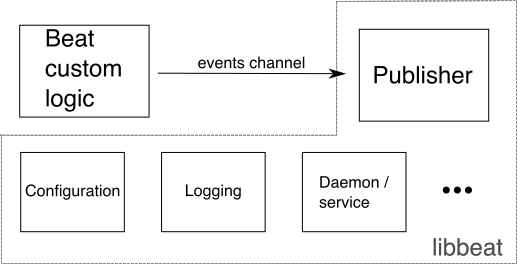
As you can see, libbeat implements the publisher, so you only need to implement the custom/bussiness logic. The problem with libbeat is that it’s only available in Go, which is unfortunate because a plethora and actually the majority of small embedded IoT devices can not execute Go. Gladly there are some C++ implementations out there like this one, that do the same in C++, but the problem with those implementations is that they only support basic authentication.
You should be aware, though, that the Go libbeat also handles buffering, which is a very important feature and you need to be aware that if you do your own implementation you should take care of that. Buffering means that if the client loses the connection, even for hours and days, then it stores the data locally and when the connection is restored then sends all the buffered data to the server. That way you won’t have discontinued data in your server’s database. Also that means that you need to choose an optimal data sampling rate, so your database doesn’t get huge in short time.
One important thing that I need to mention here is that you can write your own communication stack as it’s just a simple HTTP POST with an attached json formatted data. So you can implement this on a simple baremetal device like ESP8266, but the problem is that the authentication will be just a basic one. This means that the authentication can be a user/pass, but that’s really a joke as both are attached in an unencrypted plain HTTP POST. I guess that for your home and internal network is not much of a problem, but you need to have a proper encryption if your devices are out in the wild.
A simple example
To test a new stack, framework or technology you need to start with a simple example and create a proof of concept. As a first example in this series I’ll run an Elasticsearch (ES) server and a Kibana instance on my workstation which will act as the main server. The ES will collect all the data and the Kibana instance will provide the front-end to visualize the data. Then I’ll use an SBC and specifically the nanopi-k1-plus, which is my reference board to test my meta-allwinner-hx BSP layer. The SBC will run a Beat that collects metric data from the running OS and sends them to the Elasticsearch server. This is the system overview:
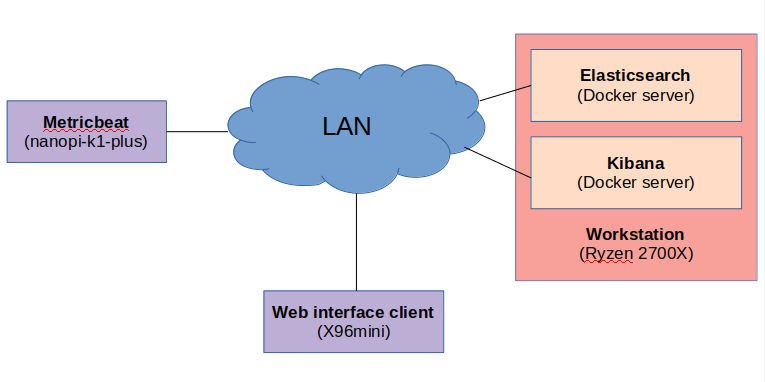
So, this is an interesting setup here. The server is my workstation which is a Ryzen 2700X with 32GB RAM and the various fast NVMe and SSDs. The Elasticsearch and Kibana servers are running inside docker containers and on a NVMe. The host OS is Ubuntu 18.04.5 LTS.
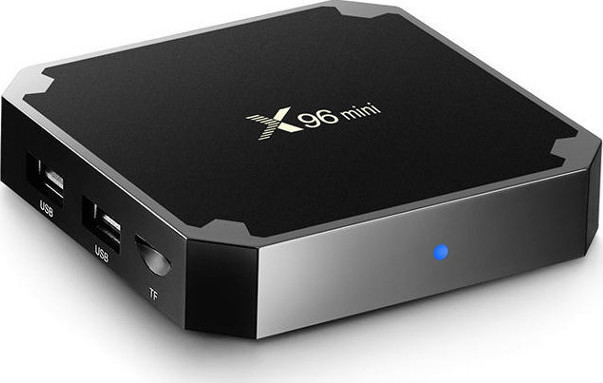
It’s funny, but for the web interface client I’m using the X96 mini TV box… OK, so this is an ARM board based on the Amlogic S905X SoC which is a quad-core Cortex-A53 running at 1.5GHz with 2GB RAM. Itcurrently runs an Armbian image with Ubuntu Focal 20.04 on the 5.7.16 kernel. The reason I’ve selected to use this SBC as a web client is to benchmark the web interface, meaning I wanted to see how long it takes for a low spec device to load the interface and how it behaves. I’ll come to this later on, anyway this how it looks like.
A neat little Linux box. Finally, I’ve used the nanopi-k1-plus with a custom Yocto Linux image using the meta-allwinner-hx BSP with the 5.8.5 kernel version. On the nanopi I’m running the metricbeat. Metricbeat is a client that collect system resources and performance data and then sends them to the Elasticsearch server.
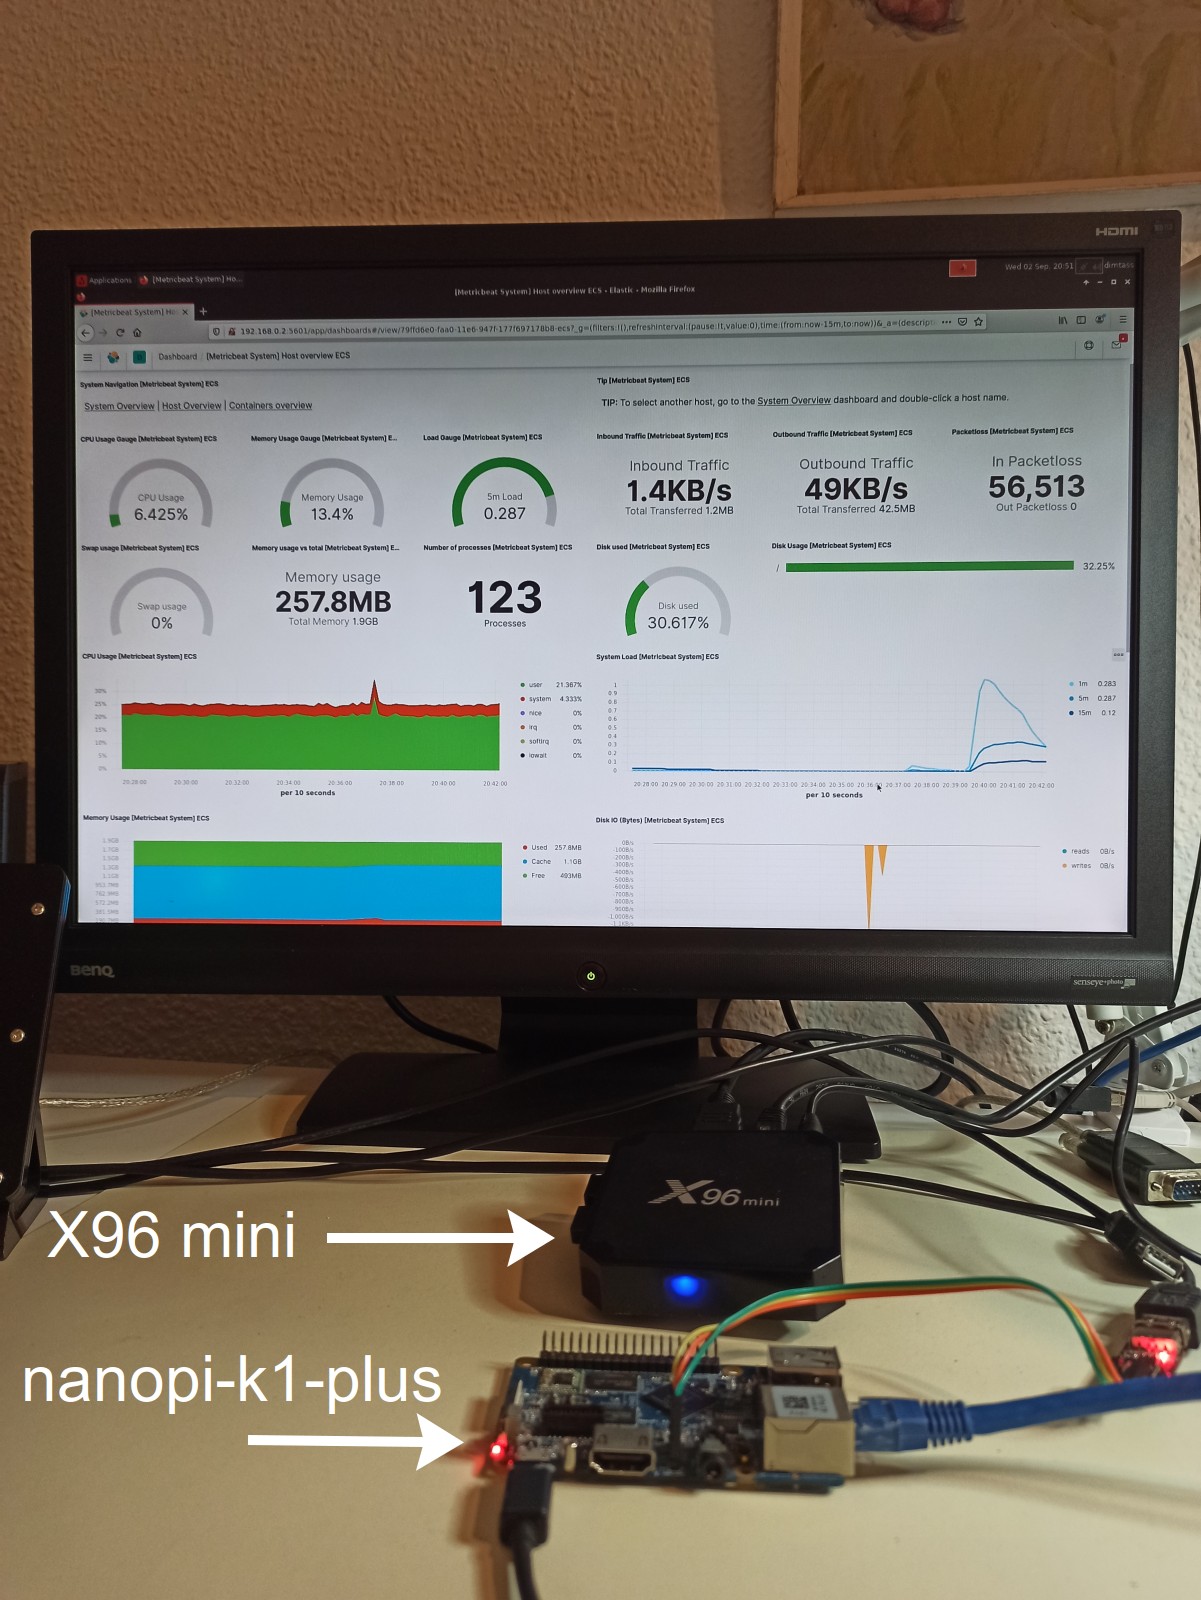
This setup might be look a bit complicated but it’s not really. It’s quite basic, I’m just using those SBCs with custom OSes that makes it look a bit complicated, but it’s really a very basic example and it’s better that running everything on the workstation host as docker containers. This setup is more fun and similar to real usage when it comes to embedded. Finally, that’s a photo of the real setup.
Running Elasticsearch and Kibana
For this project I’m running Elasticsearch and Kibana on a docker container on a Linux host and it makes total sense to do so. The reason is that the containers are sandboxed from the host and also later in a real project it makes more sense to have a fully provisioned setup as IaaC (infastructure as a code); therefore you’re able to spawn new instances and control your instances maybe using a swarm manager.
So let’s see how to setup a very basic Elasticsearch and Kibana container using docker. First head to this repo here:
- https://github.com/dimtass/elastic-stack-on-embedded.git
- https://gitlab.com/dimtass/elastic-stack-on-embedded.git
There you will see the part-1 folder which includes everything that you need for this example. In this post I’m using the latest Elastic Stack version which is 7.9.0. First you need to have docker and docker-composer installed to your workstation host. Then you need to pull the Elasticsearch and Kibana images from the docker hub with these commands:
1
2
docker pull docker.elastic.co/elasticsearch/elasticsearch:7.9.0
docker pull docker.elastic.co/kibana/kibana:7.9.0
Those two commands will download the images to your local registry. Now you can use those images to start the containers. I’ve already pushed the docker-compose file I’ve used in the repo, therefore all you need to do is to cd in the part-1 folder and run this command:
1
docker-compose -f docker-compose.yml up
This command will use the docker-compositor.yml file and launch two container instances, one for Elasticsearch and one for Kibana. Let’s see the content of the file.
1
2
3
4
5
6
7
8
9
10
11
12
13
14
15
16
17
18
19
20
21
22
23
24
25
26
27
28
29
30
31
32
33
34
35
36
version: '3'
services:
  elasticsearch:
    image: docker.elastic.co/elasticsearch/elasticsearch:7.9.0
    container_name: elastic_test_server
    environment:
      - bootstrap.memory_lock=true
      - discovery.type=single-node
      - "ES_JAVA_OPTS=-Xms512m -Xmx512m"
      - TAKE_FILE_OWNERSHIP=true
    ulimits:
      memlock:
        soft: -1
        hard: -1
    volumes:
      - /rnd2/elasticsearch/data:/usr/share/elasticsearch/data
    ports:
      - 9200:9200
      - 9300:9300
    networks:
      - elastic
  kibana:
    image: docker.elastic.co/kibana/kibana:7.9.0
    container_name: kibana_test
    ports:
      - 5601:5601
    environment:
      ELASTICSEARCH_URL: http://elastic_test_server:9200hosts:["192.168.0.2:9200"]
      ELASTICSEARCH_HOSTS: http://elastic_test_server:9200
      SERVER_HOST: 192.168.0.2
    networks:
      - elastic

networks:
  elastic:
    driver: bridge
You see that there are two services: elasticsearch and kibana. Each service uses the proper image and it has a unique container name. The ES container has a few environment variables, but the important one is the discovery.type which declares the instance as a single-node. This is important because there’s only one node and in case you had more then you need to configure those nodes in the yaml file, so they can discover each other in the network. Another important thing is that the ES volume is attached to the host’s physical drive. This is important so when you kill and remove the container instance, then the data (and the database) are not lost. Finally, the network and the network ports are configured.
The Kibana service configures the web server port, the environment variables that point to the ES server and the server host. Also it configures the service in the same network with ES and most importantly it sets the host address to the host’s IP address so the web server is also accessible from other web clients on the same network. If the SERVER_HOST is set to 0.0.0.0 then you can only access the web interface from the localhost. Final touch is that the network is bridged.
Once you run the docker compose command then both the Elasticsearch and the Kibana servers should be up and running. In order to test that everything works as expected then you need to open your browser (e.g. on your localhost) and launch this address
1
http://localhost:5601/status
It may take some time to load the interface and it might give some extra information the first time you run the web app, but eventually you should see something like this
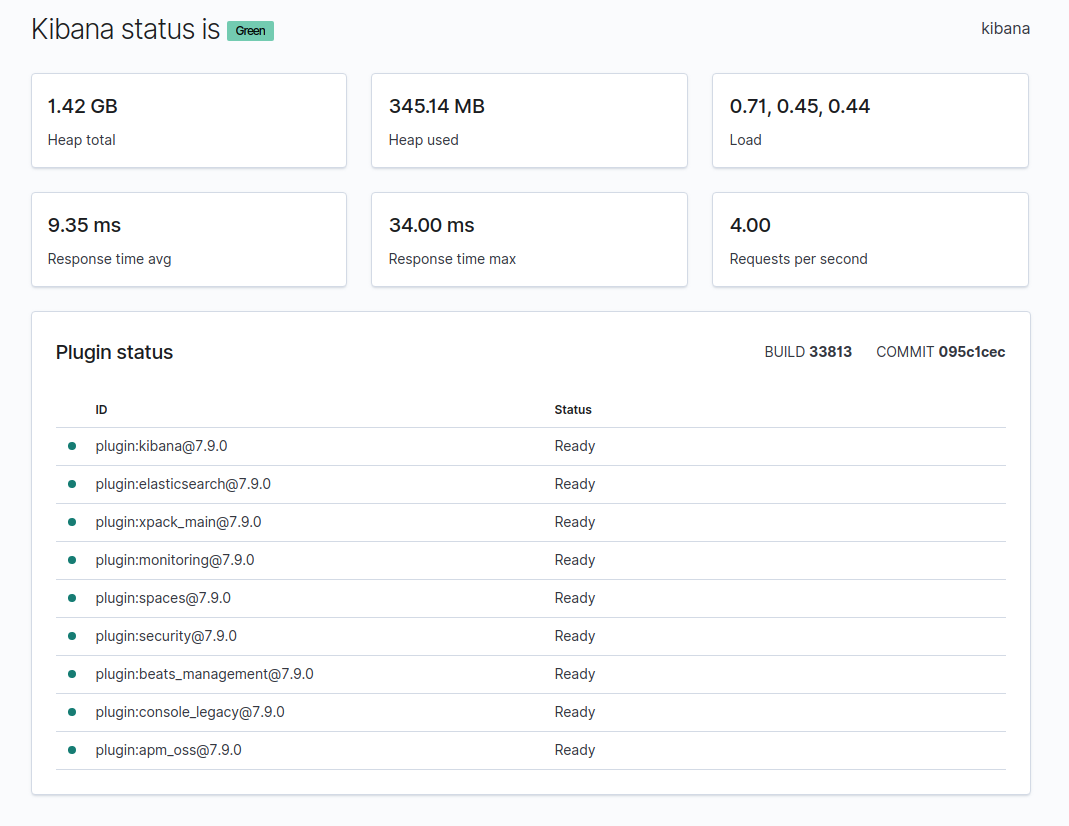
Everything should be green, but most importantly plugin:elasticsearch needs to be in ready status, which means that there’s communication between the Kibana app and the Elasticsearch server. If there’s no communication and both instances are running then there’s something wrong with the network setup.
Now it’s time to get some data!
Setting up the metricbeat client
As I’ve already mentioned the metricbeat client will run on the nanopi-k1-plus. In my case I’ve just built the console image from the meta-allwinner-hx repo. You can use any SBC instead or any distro as long as it’s arm64 and the reason for this is that there are only arm64 prebuild binaries for the official Beats. Not only that, but you can’t even find them in the download page here, and you need to use a trick to download them.
So, you can use any SBC and distro or image (e.g. an Armbian image) as long it’s compatible with arm64 and one of the available packages. In my case I’ve built the Yocto image with deb support, therefore I need a deb package and the dpkg tool in the image. To download the deb image, open your browser and fetch this link.
https://artifacts.elastic.co/downloads/beats/metricbeat/metricbeat-7.9.0-arm64.deb
Then scp the deb file to your SBC (or download it in there with wget) and then run:
1
dpkg -i filebeat-7.9.0-arm64.deb
After installing the deb package the executable will be installed in /usr/bin/metricbeat and also a service file will be installed in /lib/systemd/system and some configuration files will be installed in /etc/metricbeat. The configuration file /etc/metricbeat/metricbeat.yml is important and this is the file you need to setup the list of the remote hosts (in this case is the Elasticsearch server) and also you need to configure the module and the metricsets that you want to send from the nanopi to the ES server. To make it a bit more easy, I’ve included the metricbeat.yml file I’ve used in this example in the repo folder, so you just need to scp this file to your SBC, but don’t forget to edit the hosts line and use the IP address of your ES server.
1
2
3
4
# ---------------------------- Elasticsearch Output ----------------------------
output.elasticsearch:
  # Array of hosts to connect to.
  hosts: ["192.168.0.2:9200"]
Build Elastic beats in Yocto
I’ve written a software meta layer for Yocto that you can use to add the official Elastic beats into your image. The meta layer is here:
https://gitlab.com/dimtass/meta-elastic-beats https://github.com/dimtass/meta-elastic-beats
You can add the layer to your sources and to your bblayers.conf file and then add one or more of the following recipes to your image, using IMAGE_INSTALL.
- elastic-beats-auditbeat
- elastic-beats-filebeat
- elastic-beats-heartbeat
- elastic-beats-journalbeat
- elastic-beats-metricbeat
- elastic-beats-packetbeat
Although there are some template configuration files in the repo, it’s expected that you override them and use your own configuration yaml files. The configuration files are located in the meta-elastic-beats/recipes-devops/elastic-beats/elastic-beats folder in the repo. Also you need to read carefully the README, because golang by default sets some files as read-only and if the work directory is not cleaned properly, then the build will fail.
Show me the data
At this point, we have a running instance of an Elasticsearch server, a Kibana server and a ready-to-go SBC with the metricbeat client. Next thing to do now is to run the metricbeat client and start collecting data in the server. As I’ve mentioned earlier the deb file also installs a service file, so you can either run the executable in your terminal or even better enable and start the service.
1
2
systemctl start metricbeat
systemctl enable metricbeat
In my case I’ve just executed the binary from the serial-tty console, but for long term usage of course the service makes more sense.
Now, if you wait for a bit then the server will start receiving metric data from the SBC. In order to view your data you need to open the Kibana web interface app into your browser. I’ve tried this on both my workstation and the X96mini in order to compare the performance. On my workstation it takes a couple of seconds to load the interface, but on the X96mini it took around 1.5-2 minutes to load! Yep, that means that the user interface is resource demanding, which is a bit unfortunate as it would be nice to have an option for a lighter web interface (maybe there is and I’m not aware of it).
Next you need to click on the Kibana tab in the left menu and then click Dashboard. This will show a list of some template dashboards. You can implement your own dashboard and do whatever customizations you in the theme and the components, but for now let’s use one of the templates. Since, the nanopi sends system metric data, you need to select the [Metricbeat System] Host overview ECS template. You can limit the listed items if you search for the system keyword.
If your remote host (e.g. nanopi) doesn’t show up automatically, then in the upper left corner you need to create a new filter and set the host.name to the one of your SBC. To get the host name of your SBC, then run the uname -n in your console. In my case is:
1
host.name:"nanopi-k1-plus"
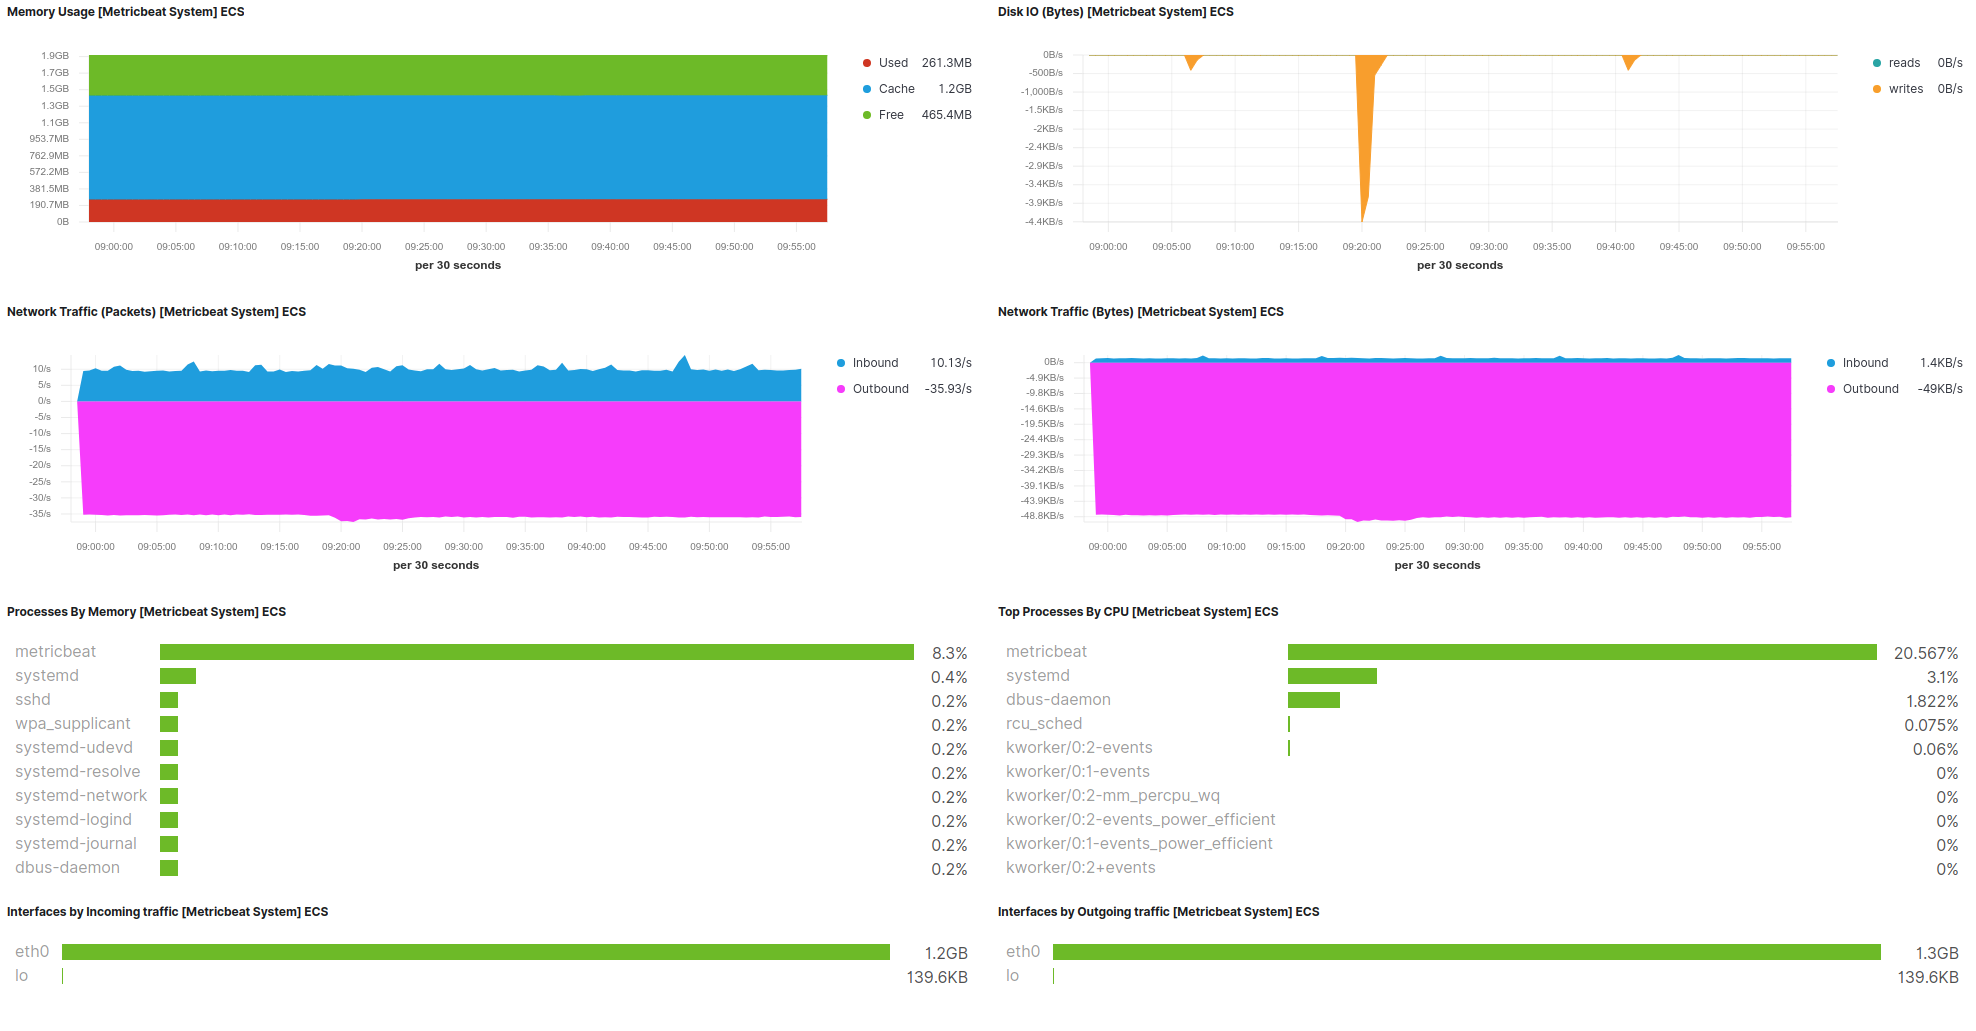
So, after applying the filter you should get your data. Just have in mind that it might need a few minutes to collect enough data to show something. The next two screenshots are from the X96mini.
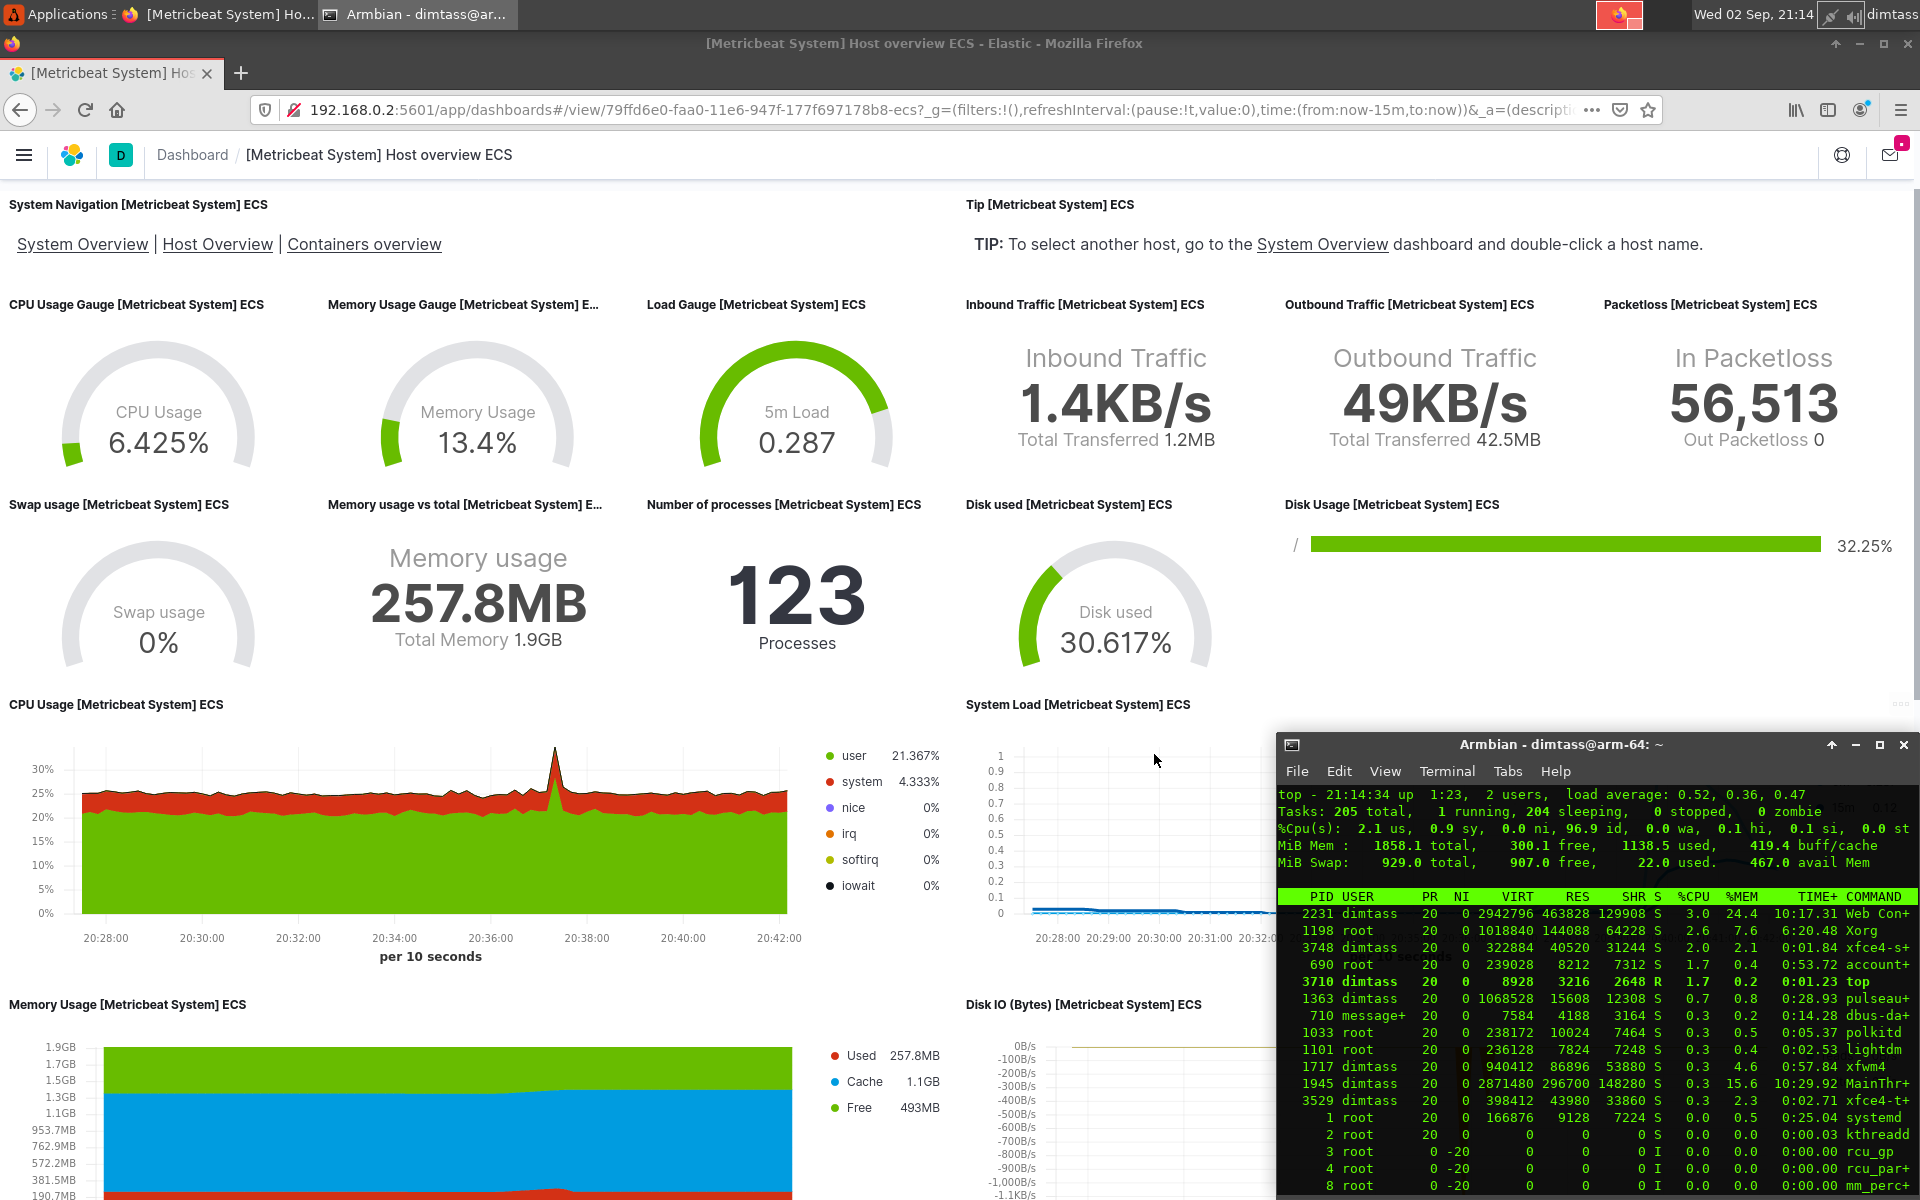
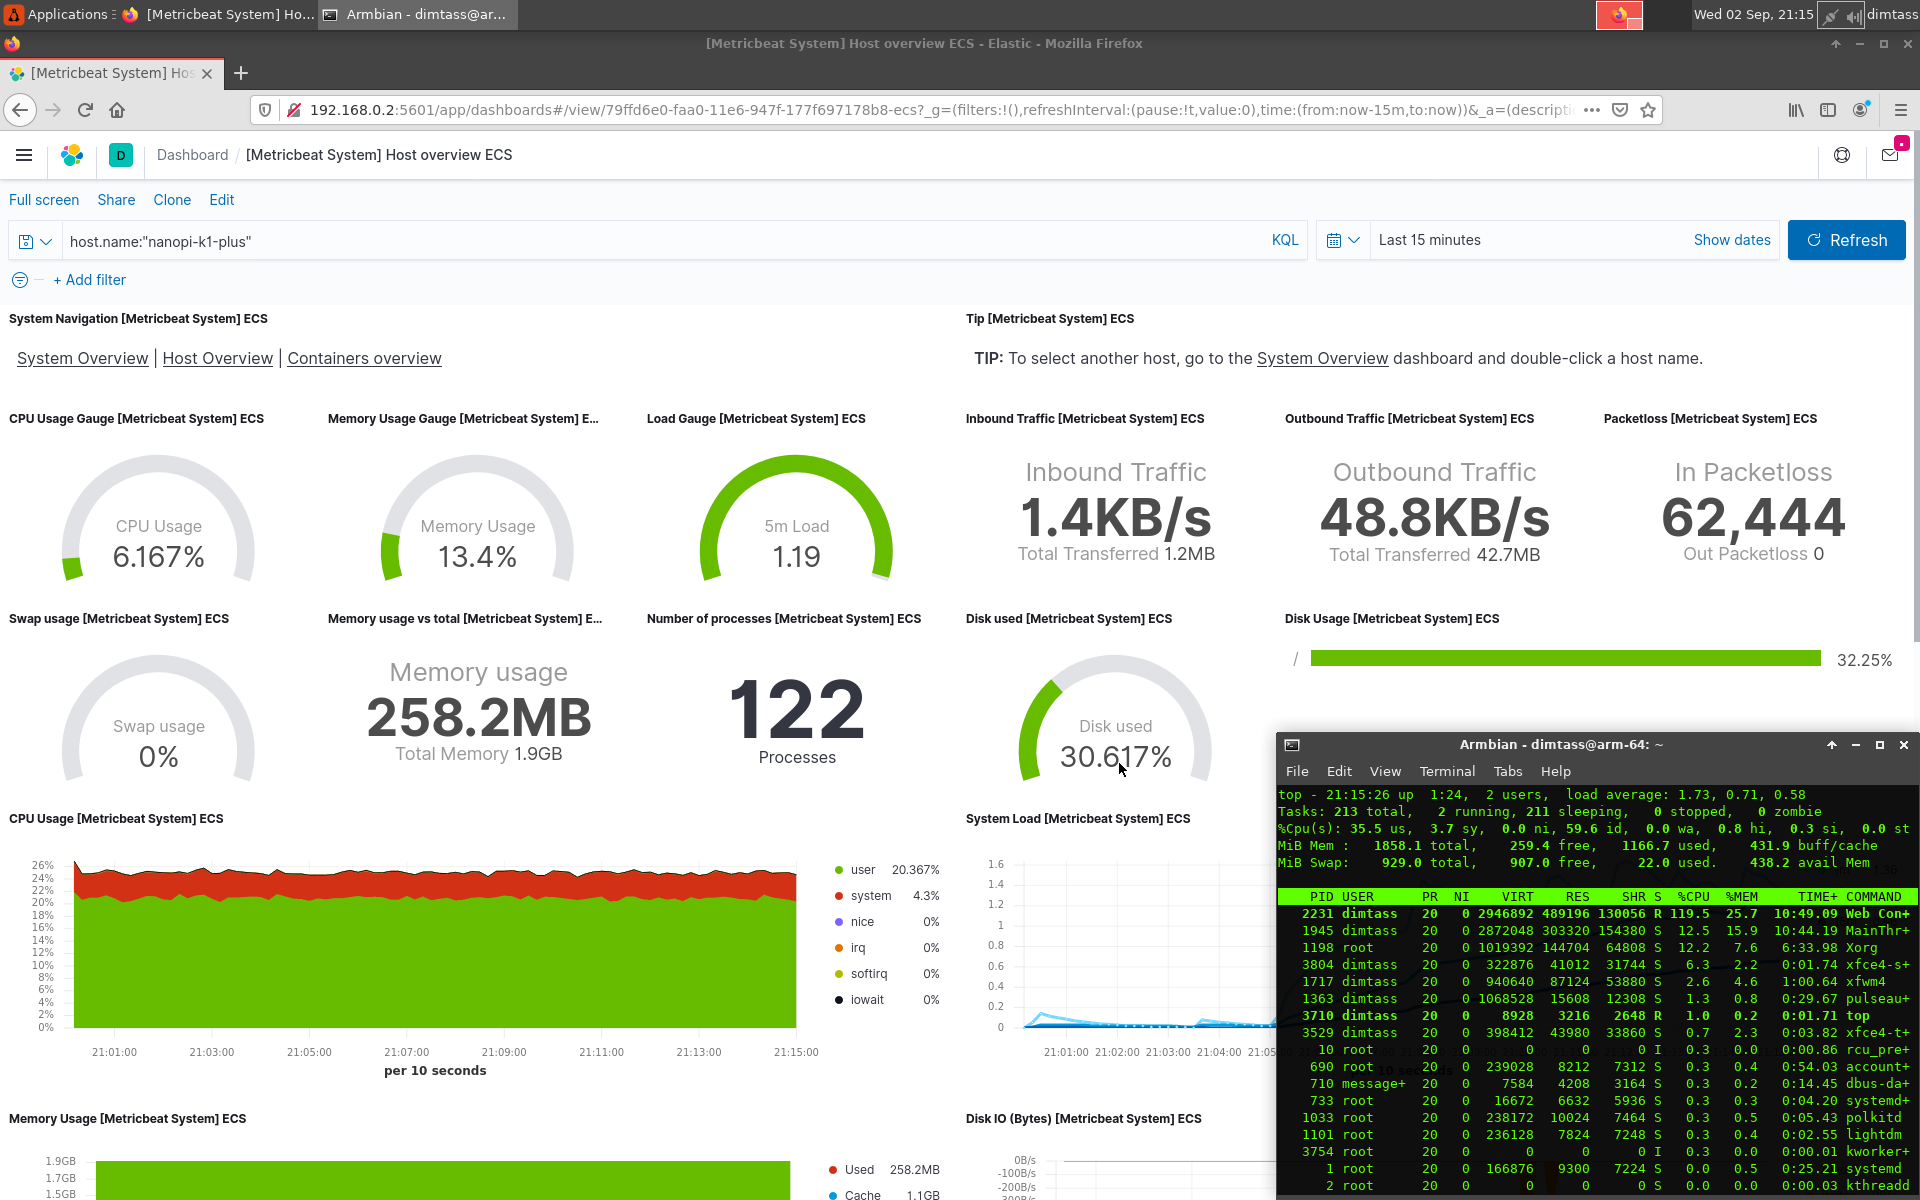
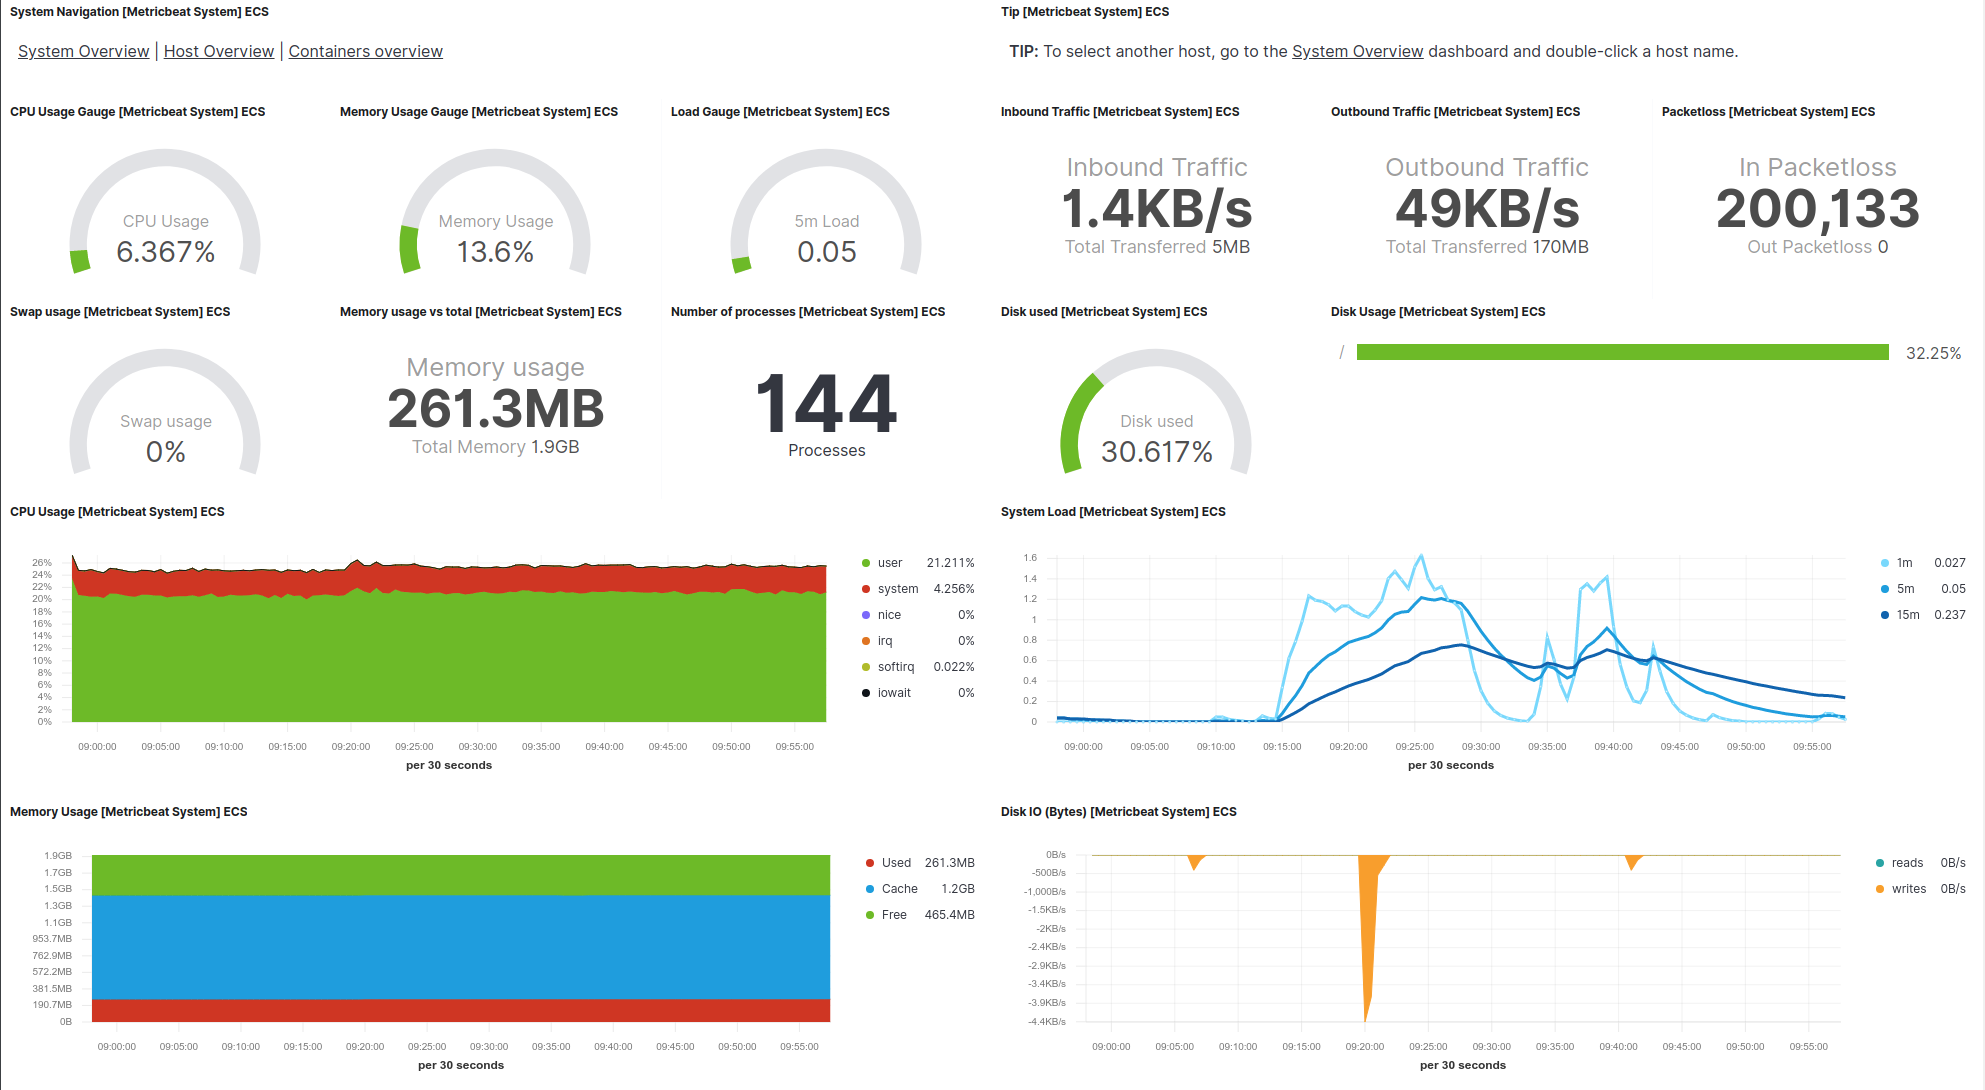
Click on the images the view them in full screen. In the first screenshot you see that the web interface is using only 3% of CPU, but it uses 24.4% of the system 2GB RAM when it’s idle! In the next screenshot I’ve pressed the Refresh button on the web interface to see what happens to the system resources. In this case the web interface needed 120% of CPU, which means that more than 1 core is utilized. The next two screenshots display all the available data in this dashboard.
Well, that’s it! Now I can monitor my nanopi-k1-plus SBC using the Kibana web app. In case you have many SBCs around running, you can monitor all of them. Of course, monitoring is just one thing you can do. There are many more things that you can do with Kibana, like for example create alerts and send notifications using the APM interface. So, for example you can create alerts for when the storage is getting low, or communication is lost or whatever you like using the available data from the remote host in the server’s database. As you understand there’s no limit in what you can do.
Conclusions
In the first post, I’ve demonstrated a very basic use case of a remote SBC that sends metric data to an Elasticsearch server by using the metricbeat client. Then I’ve shown a template dashboard in Kibana that visualizes the data of the remote client. It can’t get simpler than that, really. Setting up the ES and Kibana server was easy using docker, but as I’ve mentioned I haven’t used any of the available security features; therefore you shouldn’t use this example for a real-case scenario especially if the clients are out in the wilderness of the internet.
The pros of using a solution like this, is that it’s quite easy to setup the infrastructure, also the project is open source and it’s actively supported and there’s also an active community that creates custom beats. On the negative side is that the libbeat API is only available in Go which makes it unusable to baremetal IoT devices and also the tools of the Elastic Stack are complex and bloated, which it may be hard to debug it yourself when issues arise. Of course, the complexity is expected as you get tons of features and functionality, actually more features that you will probably use. It’s the downside of all the Swiss-army-knife solutions.
Is Elastic Stack only good for monitoring remote SBCs? No. It’s capable of many more things. You need to think about Elastic Stack like it’s just a generic stack that provides functionalities and features and what you do with this it’s up to your imagination. For example you can have hundreds or thousands of IoT devices and monitor all of them, create custom dashboards to visualize any data in any way you like, create reports, create alerts and many other things.
Where you benefit most with such tools is that they scale up more easily. You can have 5 temperature/humidity sensors in your house, or dozens of MOX sensors in an industrial environment, or hundreds of thousands environmental sensors around the world or a fleet of devices sending data to a single or multiple Elasticsearch servers. Then you can use Kibana to handle those data and create visualization dashboards and automations. Since the project is open-source, there’s actually no limit in what you can do with the information inside the database.
I hope that at some point there will be a generic C or even a C++ API similar to libbeat that doesn’t have many dependencies or even better no dependencies at all. This API should be implemented in a way that can be used in baremetal devices that run a firmware and not a RTOS capable of running Go. This would be really cool.
So, what’s next? In the next posts I’ll show how to create custom beats to use in Linux SBCs and also how to connect baremetal devices to Elasticsearch and then use Kibana to visualize the data.
Are there other similar tools? Well, yes there are a few of them, like Loggly and Splunk, but I believe that Elastic Stack could fit perfectly the IoT in the future. There are also alternatives to each component, for example Graphana is an alternative to Kibana. I guess if you are in the market for adapting such a tool you need to do your own research and investigation.
This post just scratched the surface of the very basic things that you can do with Elastic Stack, but I hope it makes somehow clear how you can use those tools in the IoT domain and what are the potentials and possibilities. Personally I like it much and I think there’s still some room for improvement to just fit the embedded world.
Have fun!
Comments powered by Disqus.